Our Mission
Kanaan Asset Managers have been managing shares, hedge funds, funds of funds, and wrap funds, in South Africa as well as offshore, as Discretionary Financial Managers (DFMs) under our Cat II (for Unit Trusts) and IIA (for Hedge Funds) licenses since 1995. Our offshore funds are denominated in USD and GBP. Our asset manager FSP license number is 528.
We are also registered tax practitioners acting as Cat I IFAs (Independent Financial Advisors) for members of the public who wish to make use of our services, but our funds are also accessible, without making use of our services as Financial Advisors, via your existing IFA. We expose clients who are making use of our IFA service, according to their risk profiles and circumstances, proportionally to three asset classes, namely: 1. Stable SA, 2. Equities SA, and 3. Global SA, mainly for compulsory contribution funds, and in the case of voluntary contribution funds, mainly our offshore funds via our administrators IAL in Mauritius, namely: 1. Stable Offshore, 2. Equity Offshore, and 3. Moriah Global, where it is possible to perform far better because of unlimited access to international shares and funds. For more information on our contrarian approach, click on Investment Approach par 9.
Professional Financial Advice
1. Why the need for a fund management license? Why not making use of the well-established funds of Old Mutual, Liberty Life, Allen Gray etc?
In South Africa, we do make use of the above mentioned three wrap funds, as it is not wise to put all the eggs in one basket with one fund, and diversifying the available investments of smaller clients and Rand denominated funds amongst 10 or more of the top South African funds is not always possible because they have minimums and/or it’s not cost-efficient, due to static fees that become expensive relative to a small investment. Because of this, our funds of funds (already exposed to those funds that, according to our research, are performing best at a certain stage) address the problem of many small investments or monthly contributions.
Another reason for a fund management qualification is the fund mandate that allows us to switch to cash very quickly (partially lately, as explained later on) or to move into the market very quickly, without first getting permission from many clients or from a specific client—something these very big funds will not do for a specific small client or small clients.
2. Why the need for an IFA (Independent Financial Advisor) in conjunction with a DFM?
One can compare it to the need for going to a medical doctor, where the doctor will make a diagnosis, prescribing medication from amongst thousands of medications that should work for the applicable patient but may be like poison for the next patient. Similarly, it is becoming increasingly difficult for the average person to discern which of the thousands of funds, shares, and financial products worldwide may be best for them. This is where the need for specialist IFAs arises, and many members of the public—initially those from England—have been making use of the more specialized and expensive services of DFMs (Discretionary Financial Managers), with some IFAs referring clients to DFMs, similar to doctors referring patients to specialists. Our funds of funds are performing above average, net of fees, even taking our additional DFA fee into account. If you do not have a working relationship with an IFA, you can approach us directly for advice.
3. We have timed the big share market crashes since 1987.
Andre Delport, the founder of Kanaan Asset Managers, discovered that he has a good instinct for timing the big share market crashes, which he accurately predicted during the 1987 share market crash, the Far East Pacific Crash of 1998, the IT Bubble Crash of 2000, and the Credit Crunch Crash of 2008. As a result, in 2003, a group of four brokers (IFA’s) from Durban approached him, suggesting a company called Xhilarator Asset Managers Pty Ltd, through which they would have marketed Kanaan Trust's funds of funds for voluntary and compulsory contributions to other IFAs.
The success of Kanaan Asset Managers, later known as Xhilarator Asset Managers Pty Ltd, in timing the big crashes became well-known even among other brand-name professional fund managers. As a result, one of the well-known fund management companies in South Africa invested R15 million of their cash flow in one of our funds of funds during 2006. By the end of 2007, just before the 2008 Credit Crunch Crash, the fund manager of Ovation Pty Ltd contacted us to inquire about our market view. We informed him that we had switched all our funds to cash. Months thereafter, world markets crashed, with the Dow Jones in America down by more than 60%, in what was called the 2008 Credit Crunch Crash. However, our Kanaan Xhilarator balanced fund of funds decreased by only 8%, and our Xhilarator fund of funds by only 16%.
Because we managed to time the big crashes, our two funds of funds performed very well. For example, during the Far East Pacific Crash of 1998, when world markets crashed by more than 60%, the Kanaan (called Xhilarator from 2003 to 2010) fund of funds for voluntary contributions grew 56% net of fees, and the Kanaan compulsory contribution fund of funds grew 52% net of fees. Both funds, until the 2008 crash, had given an average rate of return of more than 15% per annum, which can be confirmed upon request.
4. Timing share market crashes came to an end after 21 years.
We became aware of the possibility of the Credit Crunch Crash of 2008 already during 2002 when various economists started to warn that first-world countries were allowing credit to become too easily available to the average person, to the extent that a plumber could buy a house with a credit card, as well as a second and even a third house, creating a property bubble. These economists warned that if first-world countries of the so-called free market did not start to control credit, they would be forced to intervene in the share markets to protect many big companies from going bankrupt, like their political opponents, the socialists, and the communists, for the first time in the history of the free markets.
4.1 An alternative method of risk management
As mentioned, these economists predicted the so-called Quantitative Easing, where first-world governments would start to accrue debt to protect their markets from huge crashes, which would disturb the 10-year interest rate cycle for many decades, as they had to carry on with quantitative easing to prove that what they have done was the right thing, although many economists say that we may eventually see a huge world market crash because of the accumulation of debt by first-world countries caused by quantitative easing. Quantitative easing has made it impossible for fund managers like ourselves to time these big crashes, leading us to investigate an alternative method of risk management using hedge funds, in conjunction with the methodology according to the industry guideline to buy and hold well-researched growth funds, together with medium growth funds and stable bond funds in terms of a client’s risk profile and circumstances.
4.2 Fine-tuning the alternative method has taken more than 10 years
However, we noticed that during the 2008 Credit Crunch crash, even hedge funds crashed worldwide, except for a few that had performed well during the previous crashes of October 1987, the Far East Pacific Crash of 1998, the IT Bubble Crash of 2000, the Credit Crunch Crash of 2008, and the Ukraine/Covid 19 Crash of 2022. However, one could not invest in most of them because successful hedge funds tend to become too large and therefore would close their funds to new business. We had to wait for windows of opportunity when, for example, a large pension fund would withdraw from one of these hedge funds. It is only since August 1, 2021, after more than 10 years, that we have managed to assemble a full range of high-quality hedge funds for our Moriah Global fund of funds. These underlying funds have had a collective Cumulative Average Rate of Return (CAR) net of fees since January 1, 2018, of 26.29%, up to March 31, 2022, with a relatively low-Down Standard Deviation (STD) of only 3.33%. However, as we could only eliminate the underperforming hedge funds and access the good ones during August 2021, the CAR of Moriah Global has increased to only 8.72% net of fees per annum in USD to March 31, 2022, since December 1, 2012, and in ZAR 15.08% net of fees per annum, which is also above average, as shown below in paragraph 7.2.
4.3 Moriah Global USD and ZAR
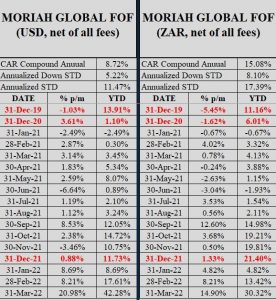
CAR (Cumulative Average Rate of Return)
STD (Standard Deviation)
For more up-to-date information, see the Moriah Global Fact Sheet and the Moriah Global ZAR Fact Sheet.
The growth of Moriah Global since August 1, 2021, is a short period, but it is nevertheless impressive, taking into account the very good growth month after month in the face of COVID-19, and even worse, the war that started in Ukraine during February 2022. Growth figures can be confirmed by the administrator of Moriah Global, IAL (International Assurance Ltd.), online at online@ialpcc.com, +230 269 4400, or https://www.international-assurance.com/contact-us.
However, the very good growth rates, as shown in paragraph 5.2 below, prior to August 1, 2021, cannot be confirmed as the names and particulars of the underlying funds are privileged business secrets.